Read Valuation Insights, Second Quarter 2018
Industry Market Multiples are available online! Visit www.duffandphelps.com/multiples
As of March 31, 2018
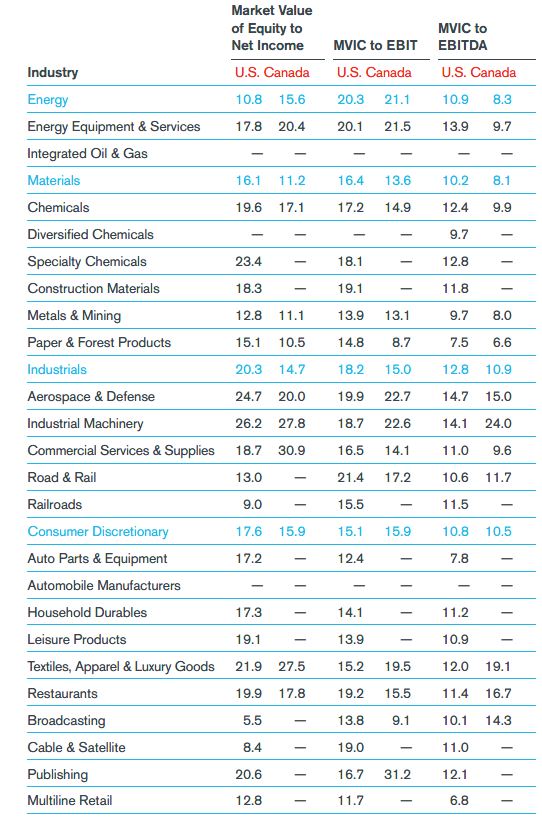
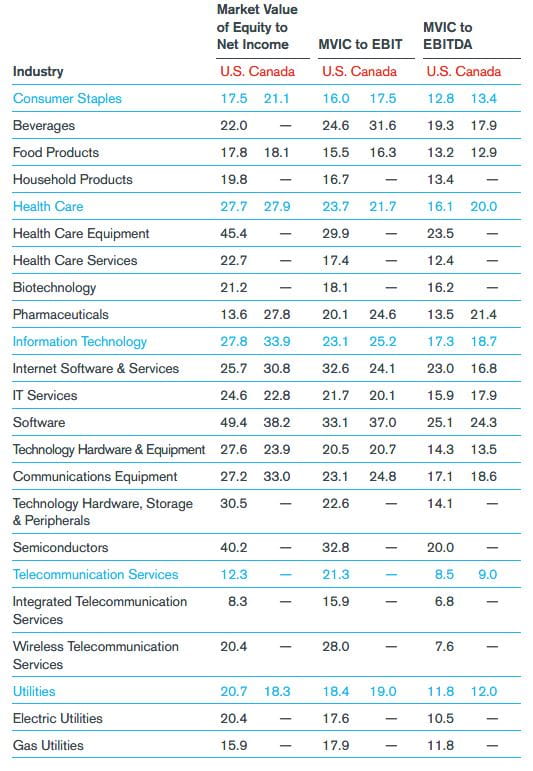
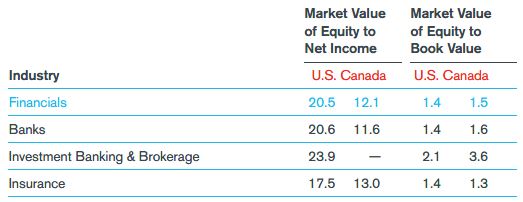
The Tax Cuts and Jobs Act (“Act”), which was enacted on December 22, 2017, had a significant one-time impact on the net income of many U.S. companies that was reported after that date. As a result, U.S. Net Income multiples may have been temporarily, but materially, impacted by some of the provisions in the Act, and which might require specific-company adjustments not reflected in the multiples reported herein. An industry must have a minimum of 5 company participants to be calculated.
For all reported multiples in the U.S. and Canada, the average number of companies in the calculation sample was 76 (U.S.), and 29 (Canada); the median number of companies in the calculation sample was 37 (U.S.), and 12 (Canada). Sample set includes publicly-traded companies (private companies are not included). Source: Data derived from Standard & Poor’s Capital IQ databases. Reported multiples are median ratios (excluding negatives or certain outliers). MVIC = Market Value of Invested Capital = Market Value of Equity plus Book Value of Debt. EBIT = Earnings Before Interest and Taxes for latest 12 months. EBITDA = Earnings Before Interest, Taxes, Depreciation and Amortization for latest 12 months. Note that due to the exclusion of negative multiples from the analysis, the number of companies used in the computation of each of the three reported multiples across the same industry may differ, which may occasionally result in a counterintuitive relationship between those multiples (e.g. the MVIC-to-EBITDA multiple may exceed MVIC to EBIT).
Valuation Advisory Services
Our valuation experts provide valuation services for financial reporting, tax, investment and risk management purposes.
